Why would you use Python to read a pcap?
For most situations involving analysis of packet captures, Wireshark is the tool of choice. And for good reason too - Wireshark provides an excellent GUI that not only displays the contents of individual packets, but also analysis and statistics tools that allow you to, for example, track individual TCP conversations within a pcap, and pull up related metrics.
There are situations, however, where the ability to process a pcap programmatically becomes extremely useful. Consider:
-
given a pcap that contains hundreds of thousands of packets, find the first connection to a particular server/service where the TCP SYN-ACK took more than 300ms to appear after the initial SYN
-
in a pcap that captures thousands of TCP connections between a client and several servers, find the connections that were prematurely terminated because of a RST sent by the client; at that point in time, determine how many other connections were in progress between that client and other servers
-
you are given two pcaps, one gathered on a SPAN port on an access switch, and another on an application server a few L3 hops away. At some point the application server sporadically becomes slow (retransmits on both sides, TCP windows shrinking etc.). Prove that it is (or is not) because of the network.
-
repeat the above exercises several times a week (or several times a day) with different sets of packet captures
In all these cases, it is immensely helpful to write a custom program to parse the pcaps and yield the data points you are looking for.
It is important to realize that we are not precluding the use of Wireshark; for example, after your program locates the proverbial needle(s) in the haystack, you can use that information (say a packet number or a timestamp) in Wireshark to look at a specific point inside the pcap and gain more insight.
So, this is the topic of this blog post: how to go about programmatically processing packet capture (pcap) files.
What programming language?
I will be using Python (3). Why Python? Apart from the well-known benefits of Python (open-source, relatively gentle learning curve, ubiquity, abundance of modules and so forth), it is also the case that Network Engineers are gaining expertise in this language and are using it in other areas of their work (device management and monitoring, workflow applications etc.).
What modules?
I will be using scapy, plus a few other modules that are not specific to packet processing or networking (argparse, pickle, pandas).
Note that there are other alternative Python modules that can be used to read and parse pcap files, like pyshark and pycapfile. Pyshark in particular is interesting because it simply leverages the underlying tshark installed on the system to do its work, so if you are in a situation where you need to leverage tshark’s powerful protocol decoding ability, pyshark is the way to go. In this blog however I am restricting myself to regular Ethernet/IPv4/TCP packets, and I can just use scapy.
The code
A few notes before we start
The code below was written and executed on Linux (Linux Mint 18.3 64-bit), but the code is OS-agnostic; it should work as well in other environments, with little or no modification.
In this post I use an example pcap file captured on my computer.
Step 1: Program skeleton
Build a skeleton for the program. This will also serve to check if your Python installation is OK.
Use the argparse module to get the pcap file name from the command line. If your argparse knowledge needs a little brushing up, you can look at my argparse recipe book, or at any other of the dozens of tutorials on the web.
import argparse
import os
import sys

def process_pcap(file_name):
    print('Opening {}...'.format(file_name))

if __name__ == '__main__':
    parser = argparse.ArgumentParser(description='PCAP reader')
    parser.add_argument('--pcap', metavar='<pcap file name>',
                        help='pcap file to parse', required=True)
    args = parser.parse_args()

    file_name = args.pcap
    if not os.path.isfile(file_name):
        print('"{}" does not exist'.format(file_name), file=sys.stderr)
        sys.exit(-1)

    process_pcap(file_name)
    sys.exit(0)
Run:
vnetman@vnetman-mint:> python3 pcap-s.py --pcap example-01.pcap
Opening example-01.pcap...
vnetman@vnetman-mint:>
Step 2: Basic pcap handling
Open the pcap and count how many packets it contains.
from scapy.utils import RawPcapReader

def process_pcap(file_name):
    print('Opening {}...'.format(file_name))

    count = 0
    for (pkt_data, pkt_metadata,) in RawPcapReader(file_name):
        count += 1

    print('{} contains {} packets'.format(file_name, count))
Run:
vnetman@vnetman-mint:> python3 pcap-s.py --pcap example-01.pcap
Opening example-01.pcap...
example-01.pcap contains 22639 packets
vnetman@vnetman-mint:>
The RawPcapReader class is provided by the scapy module. This class is iterable, and in each iteration it yields the data (i.e. packet contents) and metadata (i.e. timestamp, packet number etc.) for every packet in the capture.
At this point you may want to open the pcap in Wireshark and verify if the packet count our program reports is consistent with that reported by Wireshark.
Step 3: Filter non IPv4/TCP packets
Use scapy methods to filter out uninteresting packets. For starters, let us consider all IPv4/TCP packets as interesting.
from scapy.utils import RawPcapReader
from scapy.layers.l2 import Ether
from scapy.layers.inet import IP, TCP

def process_pcap(file_name):
    print('Opening {}...'.format(file_name))

    count = 0
    interesting_packet_count = 0

    for (pkt_data, pkt_metadata,) in RawPcapReader(file_name):
        count += 1

        ether_pkt = Ether(pkt_data)
        if 'type' not in ether_pkt.fields:
            # LLC frames will have 'len' instead of 'type'.
            # We disregard those
            continue

        if ether_pkt.type != 0x0800:
            # disregard non-IPv4 packets
            continue

        ip_pkt = ether_pkt[IP]
        if ip_pkt.proto != 6:
            # Ignore non-TCP packet
            continue

        interesting_packet_count += 1

    print('{} contains {} packets ({} interesting)'.
          format(file_name, count, interesting_packet_count))
Run:
vnetman@vnetman-mint:> python3 pcap-s.py --pcap example-01.pcap
Opening example-01.pcap...
example-01.pcap contains 22639 packets (22639 interesting)
vnetman@vnetman-mint:>
Note the use of scapy’s Ether class in the code above, and note how we use ether_pkt.fields and ether_pkt.type to extract information from the ethernet header of the packet. Also note the use of ether_pkt[IP] to obtain the IPv4 header.
It so happens that the example pcap we used was captured by tshark with a capture filter that selected all IPv4/TCP packets, which is why all 22639 packets are reported as interesting. We’ll fix that in the next iteration of the code.
Step 4: Identify interesting connection packets
The packet capture contains, among several connections, one HTTP connection between client 192.168.1.137:57080 and server 152.19.134.43:80. For the rest of this discussion let’s only consider this connection as interesting and filter out other packets.
Note that the code below hardcodes these addresses; you may instead consider gathering this information from the command-line with argparse.
def process_pcap(file_name):
    print('Opening {}...'.format(file_name))

    client = '192.168.1.137:57080'
    server = '152.19.134.43:80'

    (client_ip, client_port) = client.split(':')
    (server_ip, server_port) = server.split(':')

    count = 0
    interesting_packet_count = 0

    for (pkt_data, pkt_metadata,) in RawPcapReader(file_name):
        count += 1

        ether_pkt = Ether(pkt_data)
        if 'type' not in ether_pkt.fields:
            # LLC frames will have 'len' instead of 'type'.
            # We disregard those
            continue

        if ether_pkt.type != 0x0800:
            # disregard non-IPv4 packets
            continue

        ip_pkt = ether_pkt[IP]

        if ip_pkt.proto != 6:
            # Ignore non-TCP packet
            continue

        if (ip_pkt.src != server_ip) and (ip_pkt.src != client_ip):
            # Uninteresting source IP address
            continue

        if (ip_pkt.dst != server_ip) and (ip_pkt.dst != client_ip):
            # Uninteresting destination IP address
            continue

        tcp_pkt = ip_pkt[TCP]

        if (tcp_pkt.sport != int(server_port)) and \
           (tcp_pkt.sport != int(client_port)):
            # Uninteresting source TCP port
            continue

        if (tcp_pkt.dport != int(server_port)) and \
           (tcp_pkt.dport != int(client_port)):
            # Uninteresting destination TCP port
            continue

        interesting_packet_count += 1


    print('{} contains {} packets ({} interesting)'.
          format(file_name, count, interesting_packet_count))
Run:
vnetman@vnetman-mint:> python3 pcap-s.py --pcap example-01.pcap
Opening example-01.pcap...
example-01.pcap contains 22639 packets (14975 interesting)
vnetman@vnetman-mint:>
Step 5: Packet metadata
In this code iteration, we’ll access the packet’s metadata; in particular the timestamps and ordinal numbers (i.e. packet number within the packet capture) of the first and the last packets of the connection that we’re interested in.
def process_pcap(file_name):
    print('Opening {}...'.format(file_name))

    client = '192.168.1.137:57080'
    server = '152.19.134.43:80'

    (client_ip, client_port) = client.split(':')
    (server_ip, server_port) = server.split(':')

    count = 0
    interesting_packet_count = 0

    for (pkt_data, pkt_metadata,) in RawPcapReader(file_name):
        count += 1

        ether_pkt = Ether(pkt_data)
        if 'type' not in ether_pkt.fields:
            # LLC frames will have 'len' instead of 'type'.
            # We disregard those
            continue

        if ether_pkt.type != 0x0800:
            # disregard non-IPv4 packets
            continue

        ip_pkt = ether_pkt[IP]

        if ip_pkt.proto != 6:
            # Ignore non-TCP packet
            continue

        if (ip_pkt.src != server_ip) and (ip_pkt.src != client_ip):
            # Uninteresting source IP address
            continue

        if (ip_pkt.dst != server_ip) and (ip_pkt.dst != client_ip):
            # Uninteresting destination IP address
            continue

        tcp_pkt = ip_pkt[TCP]

        if (tcp_pkt.sport != int(server_port)) and \
           (tcp_pkt.sport != int(client_port)):
            # Uninteresting source TCP port
            continue

        if (tcp_pkt.dport != int(server_port)) and \
           (tcp_pkt.dport != int(client_port)):
            # Uninteresting destination TCP port
            continue

        interesting_packet_count += 1
        if interesting_packet_count == 1:
            first_pkt_timestamp = (pkt_metadata.tshigh << 32) | pkt_metadata.tslow
            first_pkt_timestamp_resolution = pkt_metadata.tsresol
            first_pkt_ordinal = count

        last_pkt_timestamp = (pkt_metadata.tshigh << 32) | pkt_metadata.tslow
        last_pkt_timestamp_resolution = pkt_metadata.tsresol
        last_pkt_ordinal = count
    #---

    print('{} contains {} packets ({} interesting)'.
          format(file_name, count, interesting_packet_count))

    print('First packet in connection: Packet #{} {}'.
          format(first_pkt_ordinal,
                 printable_timestamp(first_pkt_timestamp,
                                     first_pkt_timestamp_resolution)))
    print(' Last packet in connection: Packet #{} {}'.
          format(last_pkt_ordinal,
                 printable_timestamp(last_pkt_timestamp,
                                     last_pkt_timestamp_resolution)))
#---
The printable_timestamp function is defined like this:
import time

def printable_timestamp(ts, resol):
    ts_sec = ts // resol
    ts_subsec = ts % resol
    ts_sec_str = time.strftime('%Y-%m-%d %H:%M:%S', time.localtime(ts_sec))
    return '{}.{}'.format(ts_sec_str, ts_subsec)
Run:
vnetman@vnetman-mint:> python3 pcap-s.py --pcap example-01.pcap
Opening example-01.pcap...
example-01.pcap contains 22639 packets (14975 interesting)
First packet in connection: Packet #2585 2018-09-26 21:21:02.883718124
 Last packet in connection: Packet #22582 2018-09-26 21:22:04.324012912
vnetman@vnetman-mint:>
A few notes on the timestamp:
The pkt_metadata returned by this call:
for (pkt_data, pkt_metadata,) in RawPcapReader(file_name):
contains a 64-bit timestamp that is documented here. Essentially it is split into two 32-bit fields (tshigh and tslow), and represents the Unix time at which the packet was captured.
The tsresol field in metadata stores the resolution as either 1000000 (microsecond resolution) or 1000000000 (nanosecond resolution), based on the capability of the hardware/software that created the pcap. The field within the file as documented here is a 1-byte field, but the scapy RawPcapReader code processes this 1-byte field and provides the tsresol metadata as either 1000000 or 1000000000.
Step 6: Relative timestamps, relative sequence numbers, TCP flags
The output of our program at the end of this step looks like this:
-->[ 2585]  0.000000s flag=S   seq=0         ack=0         len=0
                                                                  <--[ 2586]  0.307193s flag=SA  seq=0         ack=1         len=0
-->[ 2587]  0.307242s flag=A   seq=1         ack=1         len=0
-->[ 2588]  0.307359s flag=PA  seq=1         ack=1         len=174
                                                                  <--[ 2589]  0.620760s flag=A   seq=1         ack=175       len=0
                                                                  <--[ 2590]  0.620798s flag=A   seq=1         ack=175       len=2880
-->[ 2591]  0.620823s flag=A   seq=175       ack=2881      len=0
                                                                  <--[ 2592]  0.620843s flag=A   seq=2881      ack=175       len=1440
...
...
-->[22576] 61.145739s flag=A   seq=175       ack=52313761  len=0
                                                                  <--[22577] 61.145751s flag=A   seq=52313761  ack=175       len=1440
                                                                  <--[22578] 61.147645s flag=PA  seq=52315201  ack=175       len=13483
-->[22579] 61.147676s flag=A   seq=175       ack=52328684  len=0
-->[22580] 61.148632s flag=FA  seq=175       ack=52328684  len=0
                                                                  <--[22581] 61.440260s flag=FA  seq=52328684  ack=176       len=0
-->[22582] 61.440295s flag=A   seq=176       ack=52328685  len=0
example-01.pcap contains 22639 packets (14975 interesting)
First packet in connection: Packet #2585 2018-09-26 21:21:02.883718124
 Last packet in connection: Packet #22582 2018-09-26 21:22:04.324012912
vnetman@vnetman-mint:>
- Lines beginning with
-->are packets sent from client to the server, and lines with<--are packets from the server to the client - The numbers in square brackets e.g.
[ 2588]are the packet ordinals in the capture file. This is handy if you want to examine a particular packet in detail in Wireshark. - The timestamps e.g.
0.307359sare relative to the timestamp of the first packet of the connection - The TCP flags, relative sequence number, relative acknowledgement number and TCP payload lengths are printed next
- Note, for example, the 3-way connection establishment handshake at packet numbers 2585, 2586 and 2587. Also note that the SYN-ACK came in about 307ms after the original SYN, and the ACK that followed was recorded less than 1ms after that; this is explained by the fact that the capture was taken on the client host, and the server was across the public internet.
Code:
class PktDirection(Enum):
    not_defined = 0
    client_to_server = 1
    server_to_client = 2

def process_pcap(file_name):
    print('Opening {}...'.format(file_name))

    client = '192.168.1.137:57080'
    server = '152.19.134.43:80'

    (client_ip, client_port) = client.split(':')
    (server_ip, server_port) = server.split(':')

    count = 0
    interesting_packet_count = 0

    server_sequence_offset = None
    client_sequence_offset = None

    for (pkt_data, pkt_metadata,) in RawPcapReader(file_name):
        count += 1

        ether_pkt = Ether(pkt_data)
        if 'type' not in ether_pkt.fields:
            # LLC frames will have 'len' instead of 'type'.
            # We disregard those
            continue

        if ether_pkt.type != 0x0800:
            # disregard non-IPv4 packets
            continue

        ip_pkt = ether_pkt[IP]

        if ip_pkt.proto != 6:
            # Ignore non-TCP packet
            continue

        tcp_pkt = ip_pkt[TCP]

        direction = PktDirection.not_defined

        if ip_pkt.src == client_ip:
            if tcp_pkt.sport != int(client_port):
                continue
            if ip_pkt.dst != server_ip:
                continue
            if tcp_pkt.dport != int(server_port):
                continue
            direction = PktDirection.client_to_server
        elif ip_pkt.src == server_ip:
            if tcp_pkt.sport != int(server_port):
                continue
            if ip_pkt.dst != client_ip:
                continue
            if tcp_pkt.dport != int(client_port):
                continue
            direction = PktDirection.server_to_client
        else:
            continue

        interesting_packet_count += 1
        if interesting_packet_count == 1:
            first_pkt_timestamp = (pkt_metadata.tshigh << 32) | pkt_metadata.tslow
            first_pkt_timestamp_resolution = pkt_metadata.tsresol
            first_pkt_ordinal = count

        last_pkt_timestamp = (pkt_metadata.tshigh << 32) | pkt_metadata.tslow
        last_pkt_timestamp_resolution = pkt_metadata.tsresol
        last_pkt_ordinal = count

        this_pkt_relative_timestamp = last_pkt_timestamp - first_pkt_timestamp

        if direction == PktDirection.client_to_server:
            if client_sequence_offset is None:
                client_sequence_offset = tcp_pkt.seq
            relative_offset_seq = tcp_pkt.seq - client_sequence_offset
        else:
            assert direction == PktDirection.server_to_client
            if server_sequence_offset is None:
                server_sequence_offset = tcp_pkt.seq
            relative_offset_seq = tcp_pkt.seq - server_sequence_offset

        # If this TCP packet has the Ack bit set, then it must carry an ack
        # number.
        if 'A' not in str(tcp_pkt.flags):
            relative_offset_ack = 0
        else:
            if direction == PktDirection.client_to_server:
                relative_offset_ack = tcp_pkt.ack - server_sequence_offset
            else:
                relative_offset_ack = tcp_pkt.ack - client_sequence_offset

        # Determine the TCP payload length. IP fragmentation will mess up this
        # logic, so first check that this is an unfragmented packet
        if (ip_pkt.flags == 'MF') or (ip_pkt.frag != 0):
            print('No support for fragmented IP packets')
            break

        tcp_payload_len = ip_pkt.len - (ip_pkt.ihl * 4) - (tcp_pkt.dataofs * 4)

        # Print
        fmt = '[{ordnl:>5}]{ts:>10.6f}s flag={flag:<3s} seq={seq:<9d} \
        ack={ack:<9d} len={len:<6d}'
        if direction == PktDirection.client_to_server:
            fmt = '{arrow}' + fmt
            arr = '-->'
        else:
            fmt = '{arrow:>69}' + fmt
            arr = '<--'

        print(fmt.format(arrow = arr,
                         ordnl = last_pkt_ordinal,
                         ts = this_pkt_relative_timestamp / pkt_metadata.tsresol,
                         flag = str(tcp_pkt.flags),
                         seq = relative_offset_seq,
                         ack = relative_offset_ack,
                         len = tcp_payload_len))
    #---

    print('{} contains {} packets ({} interesting)'.
          format(file_name, count, interesting_packet_count))

    print('First packet in connection: Packet #{} {}'.
          format(first_pkt_ordinal,
                 printable_timestamp(first_pkt_timestamp,
                                     first_pkt_timestamp_resolution)))
    print(' Last packet in connection: Packet #{} {}'.
          format(last_pkt_ordinal,
                 printable_timestamp(last_pkt_timestamp,
                                     last_pkt_timestamp_resolution)))
#---
Step 7: Pickling
If you’ve been executing the program in the previous steps, you will have noticed one thing: it is excruciatingly slow. This is because of scapy - for every one of the thousands of packets read from the capture file, our code builds scapy objects which, as it turns out, is an expensive and slow process.
This is a serious issue because you are, after all, developing code: each time you run the program and examine its output, you will want to write more code to tweak something, or to gain some different insight. Each time you make a small change to the code and run it, you will have to deal with its sluggishness which can get frustrating and impede progress.
The most obvious way to deal with this problem is to not use scapy at all, and instead find an alternate faster method to look at the capture packet data and metadata.
In this post, though, I will use a different approach:
- use scapy (as in the above examples) to extract interesting packet data and metadata from the capture file
- store the extracted data in a separate “custom” file on disk
- subsequently, use the extracted data from the “custom” file for analysis, display, gaining insight etc.
The Python 3 pickle module provides a generic mechanism to save (“pickle”) a bunch of Python data structures to a file on disk, and to read the file and restore (“unpickle”) the saved data structures. This is what we will be using.
The program now has two ‘modes’ of operation:
pcap-s.py pickle --pcap example-01.pcap --out example-01.dat- this runs steps 1 and 2pcap-s.py analyze --in example-01.dat- this runs step 3
Why is this better? Because you only have to run the pickle step (steps 1 and 2) once. The analyze step (step 3) - the part which you have to run repetitively after tweaking the code each time - is very fast because it does not use scapy any more.
The code below implements
- a
pickle_pcapfunction to read the given .pcap file and pickle the interesting data into a file - an
analyze_picklefunction to read the pickled data and print the same information as we did in Step 6; except, of course, that the data is now coming from the pickle file.
The argparse code to parse the command line is not shown below; please look at my argparse recipe book if you need help with using the argparse module.
The pickle step runs like this:
vnetman@vnetman-mint:> python3 ./pcap-s.py pickle --pcap example-01.pcap --out example-01.pickle
Processing example-01.pcap...
example-01.pcap contains 22639 packets (14975 interesting)
First packet in connection: Packet #2585 2018-09-26 21:21:02.883718124
 Last packet in connection: Packet #22582 2018-09-26 21:22:04.324012912
Writing pickle file example-01.pickle...done.
vnetman@vnetman-mint:> ls -go --sort=time
total 3844
-rw-rw-r-- 1  801200 Oct  8 11:36 example-01.pickle
lrwxrwxrwx 1      36 Oct  8 11:34 example-01.pcap -> ../github/pcap-files/example-01.pcap
-rwxrwxr-x 1    9199 Oct  8 08:54 pcap-s.py
-rw-rw-r-- 1  684660 Sep 25 15:47 http_espn.pcapng
-rwxrwxr-x 1    3581 Sep 13 18:40 pcap.py
-rw------- 1 2425516 Sep 10 09:02 01.pcap
vnetman@vnetman-mint:>
The run time for this step is the same as for the previous steps. This is because we have continued to use scapy to build packets from the pcap file and read their fields.
Note the ~800KB file that was created by the program. This example-01.pickle file is then used in the analyze step:
vnetman@vnetman-mint:> python3 ./pcap-s.py analyze --in example-01.pickle
##################################################################
TCP session between client 192.168.1.137:57080 and server 152.19.134.43:80
##################################################################
-->[ 2585]  0.000000s S   seq=0        ack=0        len=0      win=3737600
                                                         <--[ 2586]  0.307193s SA  seq=0        ack=1        len=0      win=1853440
-->[ 2587]  0.307242s A   seq=1        ack=1        len=0      win=29312
-->[ 2588]  0.307359s PA  seq=1        ack=1        len=174    win=29312
                                                         <--[ 2589]  0.620760s A   seq=1        ack=175      len=0      win=15616
                                                         <--[ 2590]  0.620798s A   seq=1        ack=175      len=2880   win=15616
-->[ 2591]  0.620823s A   seq=175      ack=2881     len=0      win=35072
                                                         <--[ 2592]  0.620843s A   seq=2881     ack=175      len=1440   win=15616
-->[ 2593]  0.620849s A   seq=175      ack=4321     len=0      win=37888
                                                         <--[ 2594]  0.620870s A   seq=4321     ack=175      len=5760   win=15616
...
...
...
-->[22574] 61.145550s A   seq=175      ack=52302241 len=0      win=1573504
                                                         <--[22575] 61.145725s A   seq=52302241 ack=175      len=11520  win=15616
-->[22576] 61.145739s A   seq=175      ack=52313761 len=0      win=1573504
                                                         <--[22577] 61.145751s A   seq=52313761 ack=175      len=1440   win=15616
                                                         <--[22578] 61.147645s PA  seq=52315201 ack=175      len=13483  win=15616
-->[22579] 61.147676s A   seq=175      ack=52328684 len=0      win=1573504
-->[22580] 61.148632s FA  seq=175      ack=52328684 len=0      win=1573504
                                                         <--[22581] 61.440260s FA  seq=52328684 ack=176      len=0      win=15616
-->[22582] 61.440295s A   seq=176      ack=52328685 len=0      win=1573504
vnetman@vnetman-mint:>
This display is the same as in the previous step, but it appears very fast. This is because we are no longer using scapy; instead we are reading packet fields from the pickle file.
Note also that in this step we are printing the TCP window sizes as well. We first read the scale factor from the “Window Scale Factor” TCP options in the initial SYN and SYN-ACK packets, and then, for every packet, we compute the window size and store it in the pickle file.
The code for the pickle step:
def pickle_pcap(pcap_file_in, pickle_file_out):
    print('Processing {}...'.format(pcap_file_in))

    client = '192.168.1.137:57080'
    server = '152.19.134.43:80'

    (client_ip, client_port) = client.split(':')
    (server_ip, server_port) = server.split(':')

    count = 0
    interesting_packet_count = 0

    server_sequence_offset = None
    client_sequence_offset = None

    # List of interesting packets, will finally be pickled.
    # Each element of the list is a dictionary that contains fields of interest
    # from the packet.
    packets_for_analysis = []

    client_recv_window_scale = 0
    server_recv_window_scale = 0

    for (pkt_data, pkt_metadata,) in RawPcapReader(pcap_file_in):
        count += 1

        ether_pkt = Ether(pkt_data)
        if 'type' not in ether_pkt.fields:
            # LLC frames will have 'len' instead of 'type'.
            # We disregard those
            continue

        if ether_pkt.type != 0x0800:
            # disregard non-IPv4 packets
            continue

        ip_pkt = ether_pkt[IP]

        if ip_pkt.proto != 6:
            # Ignore non-TCP packet
            continue

        tcp_pkt = ip_pkt[TCP]

        direction = PktDirection.not_defined

        if ip_pkt.src == client_ip:
            if tcp_pkt.sport != int(client_port):
                continue
            if ip_pkt.dst != server_ip:
                continue
            if tcp_pkt.dport != int(server_port):
                continue
            direction = PktDirection.client_to_server
        elif ip_pkt.src == server_ip:
            if tcp_pkt.sport != int(server_port):
                continue
            if ip_pkt.dst != client_ip:
                continue
            if tcp_pkt.dport != int(client_port):
                continue
            direction = PktDirection.server_to_client
        else:
            continue

        interesting_packet_count += 1
        if interesting_packet_count == 1:
            first_pkt_timestamp = (pkt_metadata.tshigh << 32) | pkt_metadata.tslow
            first_pkt_timestamp_resolution = pkt_metadata.tsresol
            first_pkt_ordinal = count

        last_pkt_timestamp = (pkt_metadata.tshigh << 32) | pkt_metadata.tslow
        last_pkt_timestamp_resolution = pkt_metadata.tsresol
        last_pkt_ordinal = count

        this_pkt_relative_timestamp = last_pkt_timestamp - first_pkt_timestamp

        if direction == PktDirection.client_to_server:
            if client_sequence_offset is None:
                client_sequence_offset = tcp_pkt.seq
            relative_offset_seq = tcp_pkt.seq - client_sequence_offset
        else:
            assert direction == PktDirection.server_to_client
            if server_sequence_offset is None:
                server_sequence_offset = tcp_pkt.seq
            relative_offset_seq = tcp_pkt.seq - server_sequence_offset

        # If this TCP packet has the Ack bit set, then it must carry an ack
        # number.
        if 'A' not in str(tcp_pkt.flags):
            relative_offset_ack = 0
        else:
            if direction == PktDirection.client_to_server:
                relative_offset_ack = tcp_pkt.ack - server_sequence_offset
            else:
                relative_offset_ack = tcp_pkt.ack - client_sequence_offset

        # Determine the TCP payload length. IP fragmentation will mess up this
        # logic, so first check that this is an unfragmented packet
        if (ip_pkt.flags == 'MF') or (ip_pkt.frag != 0):
            print('No support for fragmented IP packets')
            return False

        tcp_payload_len = ip_pkt.len - (ip_pkt.ihl * 4) - (tcp_pkt.dataofs * 4)

        # Look for the 'Window Scale' TCP option if this is a SYN or SYN-ACK
        # packet.
        if 'S' in str(tcp_pkt.flags):
            for (opt_name, opt_value,) in tcp_pkt.options:
                if opt_name == 'WScale':
                    if direction == PktDirection.client_to_server:
                        client_recv_window_scale = opt_value
                    else:
                        server_recv_window_scale = opt_value
                    break

        # Create a dictionary and populate it with data that we'll need in the
        # analysis phase.

        pkt_data = {}
        pkt_data['direction'] = direction
        pkt_data['ordinal'] = last_pkt_ordinal
        pkt_data['relative_timestamp'] = this_pkt_relative_timestamp / \
                                         pkt_metadata.tsresol
        pkt_data['tcp_flags'] = str(tcp_pkt.flags)
        pkt_data['seqno'] = relative_offset_seq
        pkt_data['ackno'] = relative_offset_ack
        pkt_data['tcp_payload_len'] = tcp_payload_len
        if direction == PktDirection.client_to_server:
            pkt_data['window'] = tcp_pkt.window << client_recv_window_scale
        else:
            pkt_data['window'] = tcp_pkt.window << server_recv_window_scale

        packets_for_analysis.append(pkt_data)
    #---

    print('{} contains {} packets ({} interesting)'.
          format(pcap_file_in, count, interesting_packet_count))

    print('First packet in connection: Packet #{} {}'.
          format(first_pkt_ordinal,
                 printable_timestamp(first_pkt_timestamp,
                                     first_pkt_timestamp_resolution)))
    print(' Last packet in connection: Packet #{} {}'.
          format(last_pkt_ordinal,
                 printable_timestamp(last_pkt_timestamp,
                                     last_pkt_timestamp_resolution)))

    print('Writing pickle file {}...'.format(pickle_file_out), end='')
    with open(pickle_file_out, 'wb') as pickle_fd:
        pickle.dump(client, pickle_fd)
        pickle.dump(server, pickle_fd)
        pickle.dump(packets_for_analysis, pickle_fd)
    print('done.')

#---
In other words, for every packet we read from the pcap, we build a Python dictionary that contains the values of the packet attributes we are interested in (‘direction’, ‘ordinal’, ‘relative_timestamp’, ‘tcp_flags’, ‘seqno’, ‘ackno’, ‘tcp_payload_len’ and ‘window’). Each dictionary is then appended to a list (packets_for_analysis). Once all packets are processed, the list is “pickled” and stored in the file.
The code for the analyze step:
def analyze_pickle(pickle_file_in):

    packets_for_analysis = []

    with open(pickle_file_in, 'rb') as pickle_fd:
        client_ip_addr_port = pickle.load(pickle_fd)
        server_ip_addr_port = pickle.load(pickle_fd)
        packets_for_analysis = pickle.load(pickle_fd)

    # Print a header
    print('##################################################################')
    print('TCP session between client {} and server {}'.
          format(client_ip_addr_port, server_ip_addr_port))
    print('##################################################################')

    # Print format string
    fmt = ('[{ordnl:>5}]{ts:>10.6f}s {flag:<3s} seq={seq:<8d} '
           'ack={ack:<8d} len={len:<6d} win={win:<9d}')

    for pkt_data in packets_for_analysis:

        direction = pkt_data['direction']

        if direction == PktDirection.client_to_server:
            print('{}'.format('-->'), end='')
        else:
            print('{:>60}'.format('<--'), end='')

        print(fmt.format(ordnl = pkt_data['ordinal'],
                         ts = pkt_data['relative_timestamp'],
                         flag = pkt_data['tcp_flags'],
                         seq = pkt_data['seqno'],
                         ack = pkt_data['ackno'],
                         len = pkt_data['tcp_payload_len'],
                         win = pkt_data['window']))
Step 8: Plotting the client window size
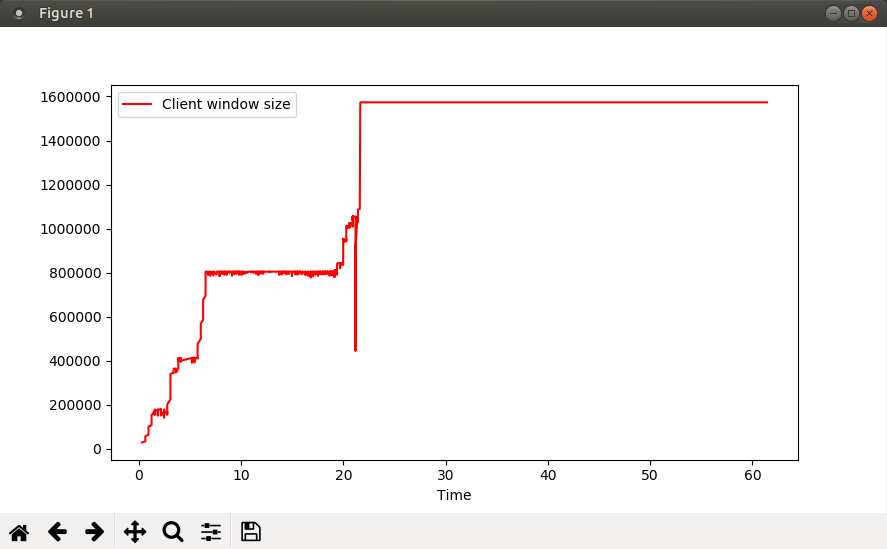
The goal in this iteration of the code is to generate a graphical plot of the TCP Receive window on the Client. The end result is a graph that looks like this:
The code for generating the plot shown above, using pandas and matplotlib, is almost ridiculously easy (I am only showing the analyze_pickle function):
import pandas as pd
import matplotlib
import matplotlib.pyplot as plt

def analyze_pickle(pickle_file_in):

    packets_for_analysis = []

    with open(pickle_file_in, 'rb') as pickle_fd:
        client_ip_addr_port = pickle.load(pickle_fd)
        server_ip_addr_port = pickle.load(pickle_fd)
        packets_for_analysis = pickle.load(pickle_fd)

    # Plot the receive window size on the client side.
    client_pkts = []
    for pkt_data in packets_for_analysis:
        if pkt_data['direction'] == PktDirection.server_to_client:
            continue

        # Don't include the SYN packet
        if 'S' in pkt_data['tcp_flags']:
            continue

        client_pkts.append({'Time': pkt_data['relative_timestamp'],
                            'Client window size': pkt_data['window']})

    df = pd.DataFrame(data=client_pkts)
    df.plot(x='Time', y='Client window size', color='r')
    plt.show()
    plt.close()
You will notice from the graph that the window size shows a sudden dip to some value between 400000 and 500000 shortly after timestamp 21.1. If you find this suspicious, you can again write more code to help you narrow down the exact packet number in the capture:
def analyze_pickle(pickle_file_in):

    packets_for_analysis = []

    with open(pickle_file_in, 'rb') as pickle_fd:
        client_ip_addr_port = pickle.load(pickle_fd)
        server_ip_addr_port = pickle.load(pickle_fd)
        packets_for_analysis = pickle.load(pickle_fd)

    for pkt_data in packets_for_analysis:
        if pkt_data['direction'] == PktDirection.server_to_client:
            continue

        # Don't include the SYN packet
        if 'S' in pkt_data['tcp_flags']:
            continue

        if pkt_data['relative_timestamp'] < 21.1:
            continue

        if pkt_data['window'] < 500000:
            print('Packet ordinal {} has a suspicious TCP window size ({})'.
                  format(pkt_data['ordinal'], pkt_data['window']))
Run:
vnetman@vnetman-mint:> python3 ./pcap-s.py analyze --in example-01.pickle
Packet ordinal 9539 has a suspicious TCP window size (444672)
vnetman@vnetman-mint:>
Armed with this data, you can now open the capture file in Wireshark and take a closer look at what happened shortly before packet #9539.
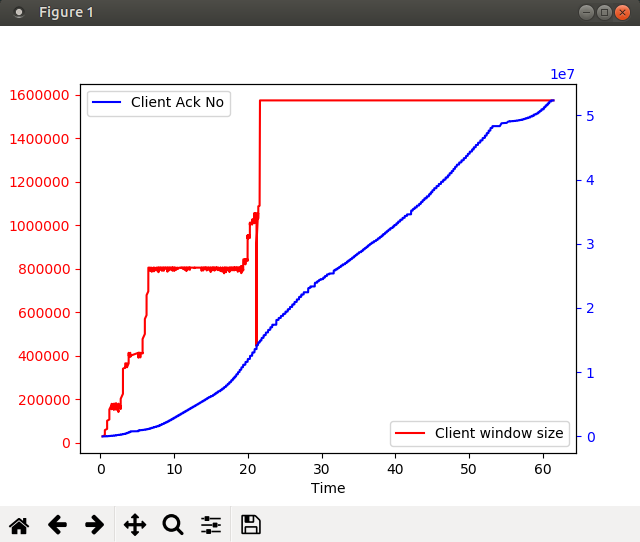
Here’s a fancier plot, where I am plotting two parameters - the client window size, and the ack number sent by the client (i.e. the number of bytes received thus far from the server):
And the analyze_pickle code for the above looks like this:
def analyze_pickle(pickle_file_in):
    packets_for_analysis = []

    with open(pickle_file_in, 'rb') as pickle_fd:
        client_ip_addr_port = pickle.load(pickle_fd)
        server_ip_addr_port = pickle.load(pickle_fd)
        packets_for_analysis = pickle.load(pickle_fd)

    # Plot the receive window size and ack number on the client side.
    client_pkts = []
    for pkt_data in packets_for_analysis:
        if pkt_data['direction'] == PktDirection.server_to_client:
            continue

        # Don't include the SYN packet
        if 'S' in pkt_data['tcp_flags']:
            continue

        client_pkts.append({'Time': pkt_data['relative_timestamp'],
                            'Client window size': pkt_data['window'],
                            'Client Ack No' : pkt_data['ackno']})

    df = pd.DataFrame(data=client_pkts)

    fig, ax1 = plt.subplots()
    ax2 = ax1.twinx()

    df.plot(x='Time', y='Client window size', color='r', ax=ax1)
    df.plot(x='Time', y='Client Ack No', color='b', ax=ax2)

    ax1.tick_params('y', colors='r')
    ax2.tick_params('y', colors='b')

    plt.show()
    plt.close()
Summary
With Python code, you can iterate over the packets in a pcap, extract relevant data, and process that data in ways that make sense to you. You can use code to go over the pcap and locate a specific sequence of packets (i.e. locate the needle in the haystack) for later analysis in a GUI tool like Wireshark. Or you can create customized graphical plots that can help you visualize the packet information. Further, since this is all code, you can do this repeatedly with multiple pcaps.